Zika Exposed
CARTO, 2016
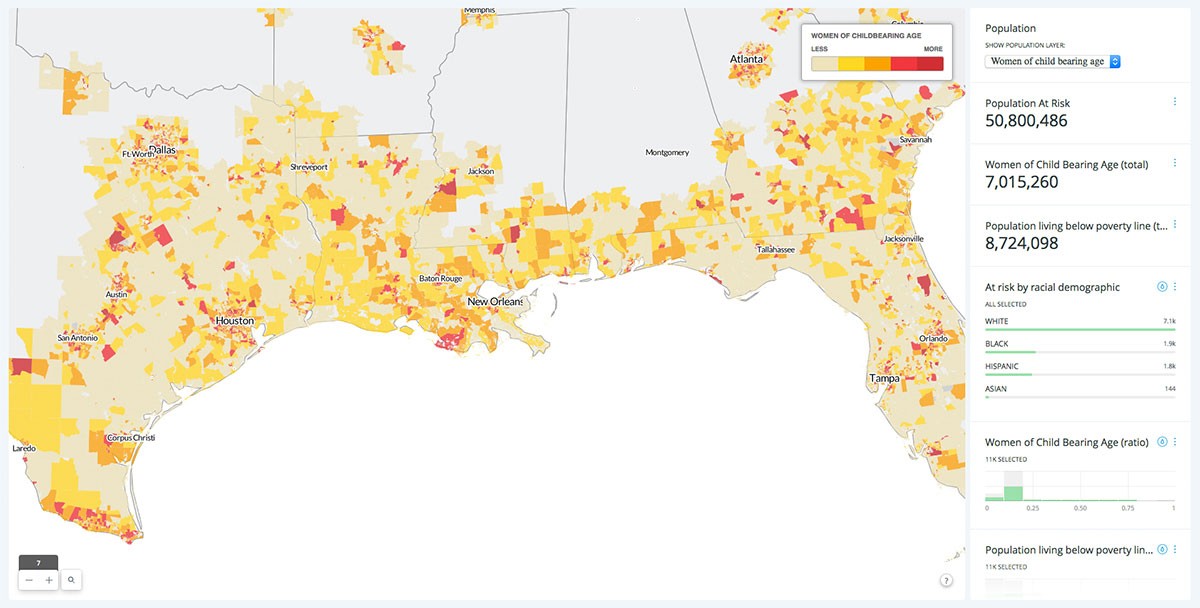
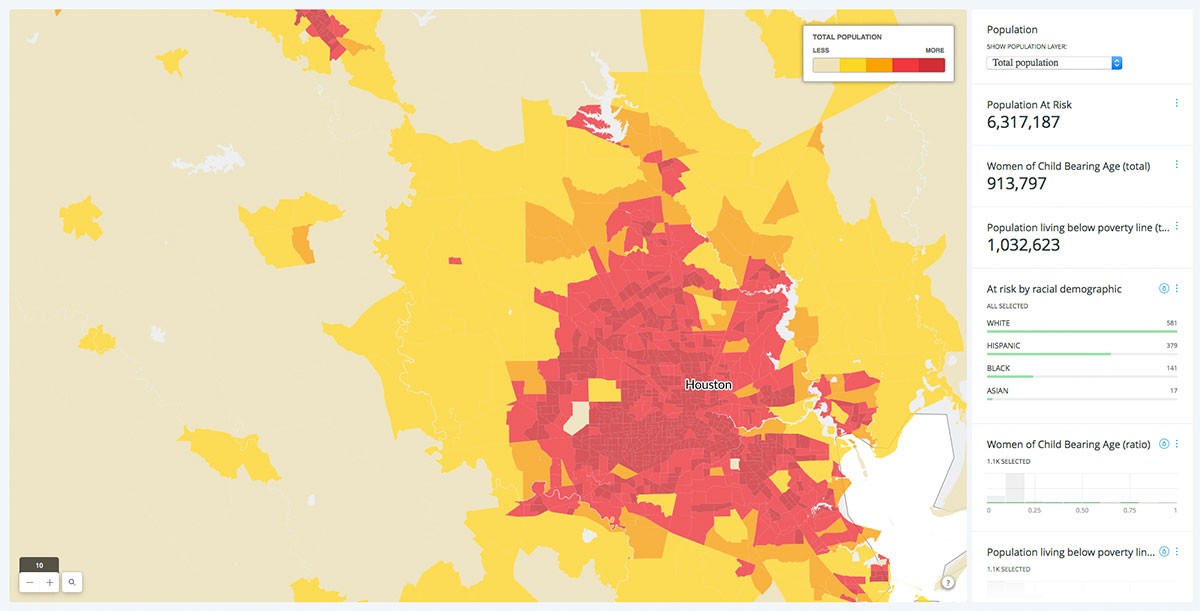
The Zika exposed project began as an exploration into the spread of the disease by trying to understand the environmental necessities for native cases to arise. We were able to visualize and further analyze a recent research providing fine grained data on what areas of the world and the US are at risk, the Zika Environmental Sustainability Index (See link 2). This data in conjunction with the Center for Disease Control's data on cases and outbreaks, showed that while at the time there had only been native cases in South America, the estimated possible spread for the year was quite high. We were able to more deeply understand the potentials in various countries of the world by building a dashboard that allowed for index calculations by country (See link 2). Taking a more granular look at the environmental values with data from Natural Earth showed that the index was much higher in urban areas with large populations. Urban factors even contributed to the disease likely being found as far north as New York City.
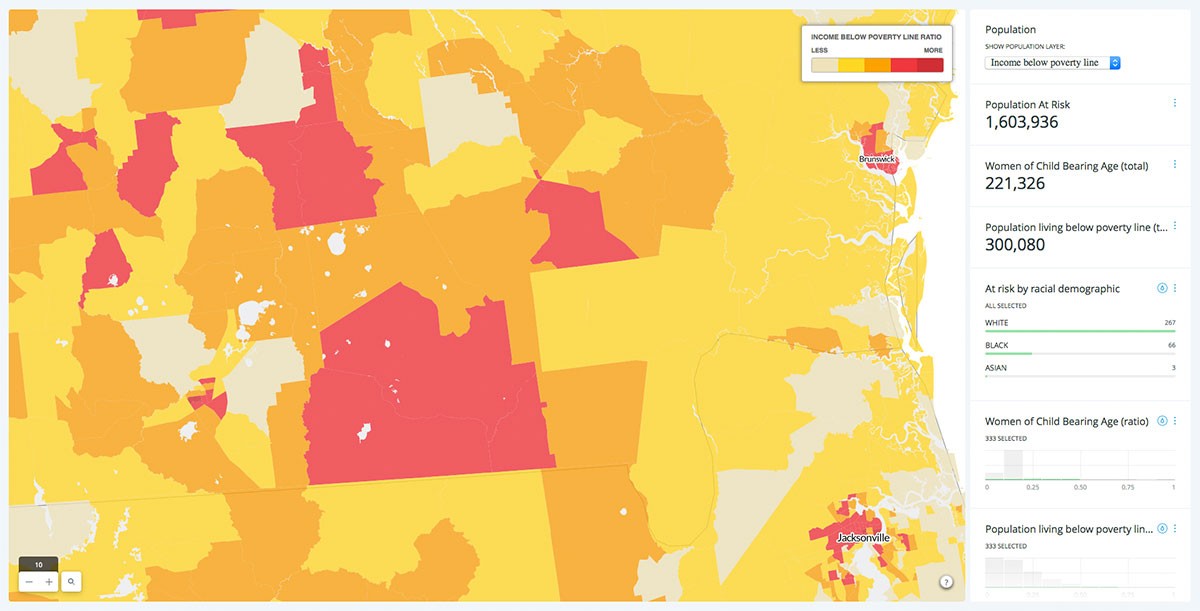
We were interested in understanding how far the Zika virus would spread, and chose to focus on The United States as many of our own family members we're in the southern part of the country. By using US census information juxtaposed against the Zika environmental sustainability index, we were able to create a dynamic exploratory tool for understanding where populations at highest risk were. The main focus of many campaigns have been targeting women of child bearing age. This is because while the virus shows few symptoms, it has the most severe health impacts on children born from mothers carrying the virus. In addition to that, prevention and education about Zika, as well as medical services, are least available in populated areas with high rates of poverty. The ability to explore these factors visually in the areas with high probability of Zika spread, in addition to interactively being able to navigate specific ratios and locations (See link 1), makes the Zika exposed dashboard a powerful tool for governments and non-profit organizations working with these topics.
Links
- http://cartodb.github.io/zika/...
- http://cartodb.github.io/zika/...
- http://cartodb.github.io/zika/...
Authors
Project Partner
Wall Street Journal