Civar
Happern - KUAR, Koç University, 2018
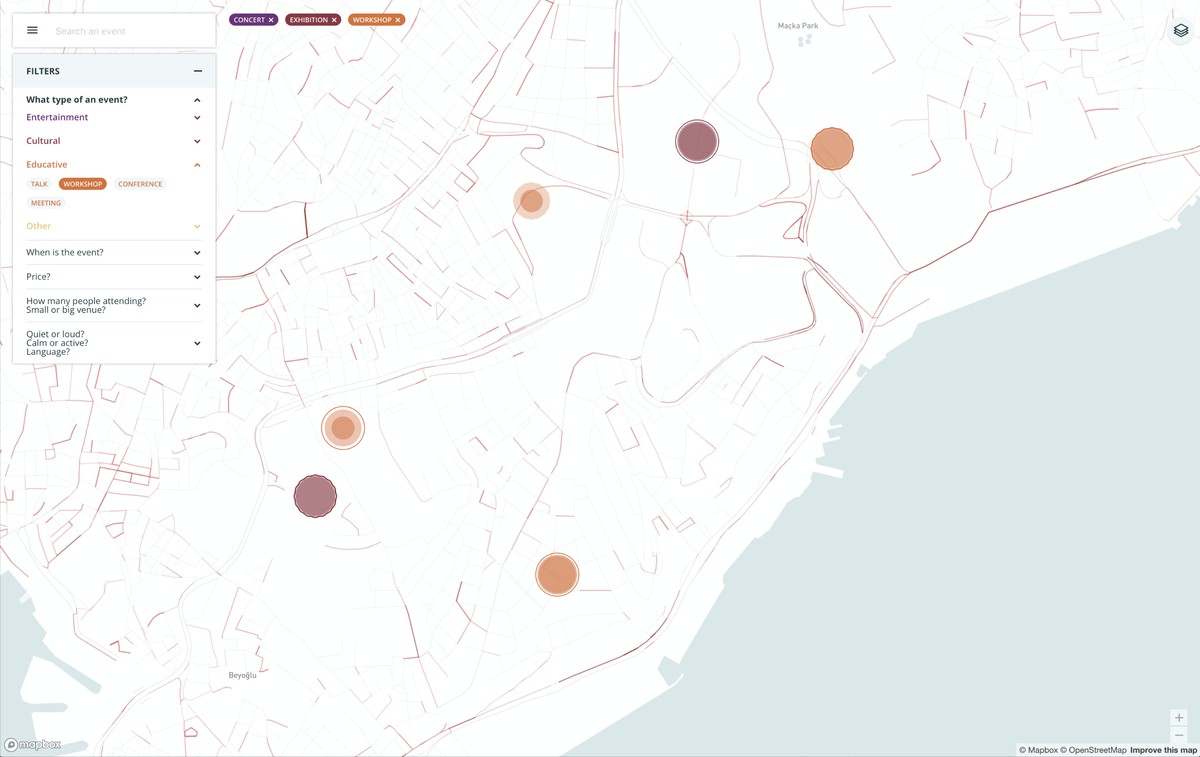
"Civar is a map for event exploration, based on real user needs. Citizens have different preferences when it comes to going out. We sometimes look for a live and crowded party on a Friday night, or a small meetup about science-fiction literature, around where we live. These decisions are also affected by the traffic jam, people density in the area or how the weather is that day.
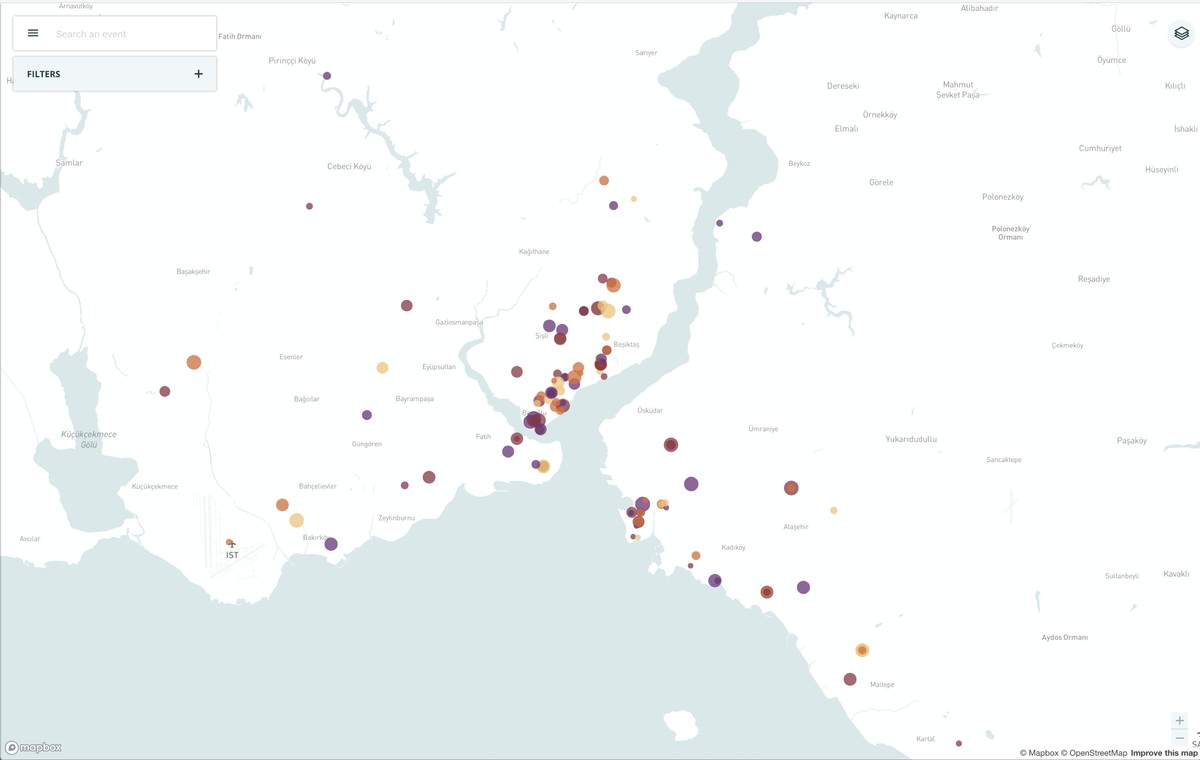
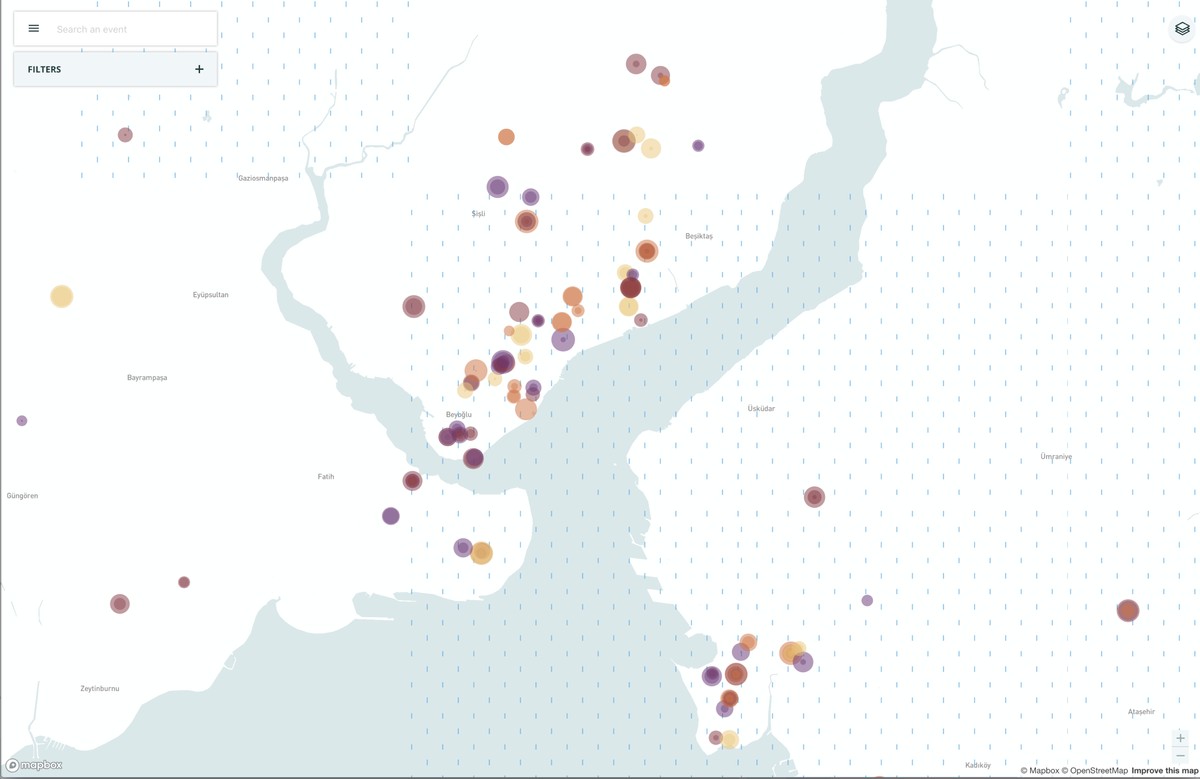
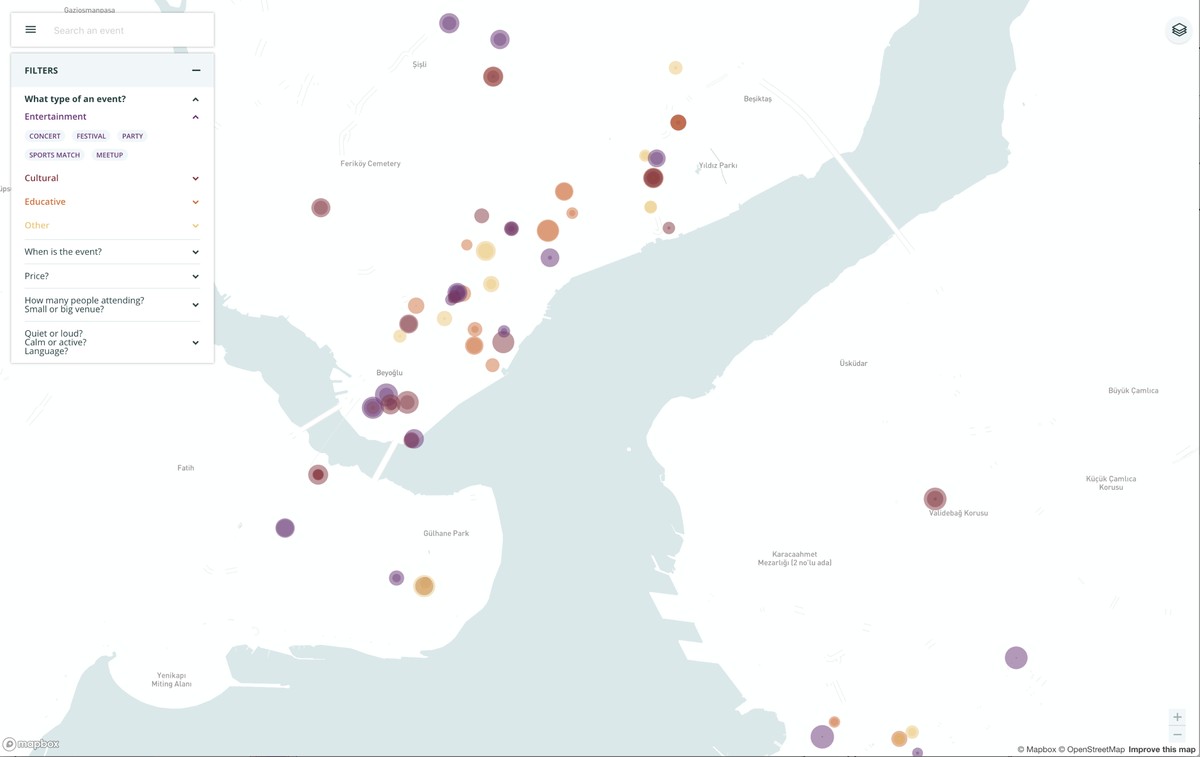
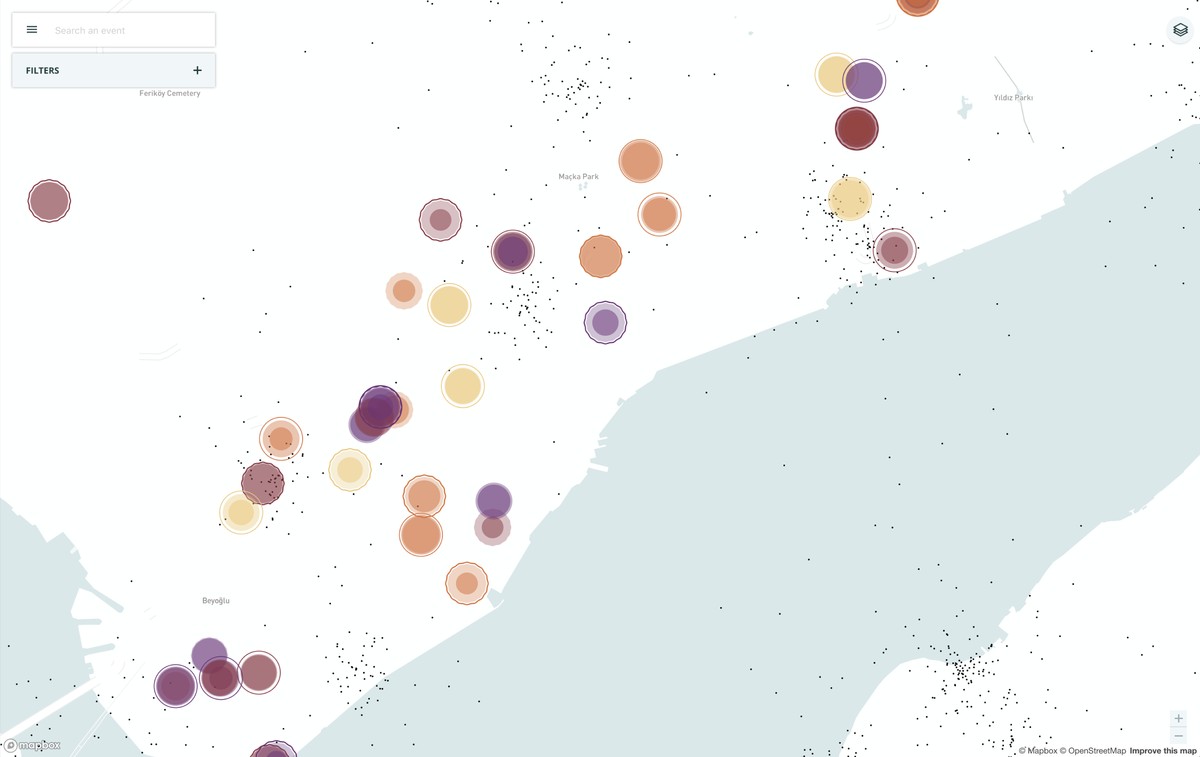
We started this project by collecting user needs, not data. Our participants from diverse backgrounds had a wide range of criteria for choosing an event. Overall, they wanted to know what, when and where the event is. However, they also wanted to know how loud or active it is, how much it costs, how many people are attending, how big is the venue, what language the event is. Civar visualizes these different dimensions of event data to fulfill diverse user needs about discovering events. We designed a circle glyph that gradually becomes more detailed, to visualize more dimensions of event data without overwhelming the user. At the city level, color coding indicates the type of event and the scale of the circle shows how many users are attending the event. At the district level, a second nested circle means how much room left at the event. At street level, the straight circle indicates if the event is loud and a zig-zagged circle indicates if the event is physically active. These visualized dimensions enable exploration at different levels of detail. After we got initial feedback from the users on our design, we started collecting data from publicly available sources and social media. We are constantly working to find more accurate, diverse and open data sources for Civar.
In addition to event discovery, real-time data layers (traffic, people density, and weather) enable creating rich insights about the city. These insights can be useful for researchers and decision makers to get a deeper understanding of how the city lives. Overall, Civar aims to reflect the city in its intricate, living existence in an explorable way.
This project is a part of a Ph.D. research project that focuses on the question ?How could we visualize geographical data to support everyday decision making about events?? (https://happern.ku.edu.tr/projects-2/eventmap/)
Links
Authors
Project Partner
KUAR, Koç University

