Thematic Background
Visualization as a tool for analysis, exploration and communication has become a driving force in the task of unravelling the complex urban fabrics that form our cities. Yet, there is a crucial need to bridge the gap between the flood of urban data and the capacity of decision makers to integrate that data into effective and informed decisions. The CityVis workshop wants to critically assess this notion and ask how data and data visualization can be used to serve and better understand or even organize urban processes, focusing on an explicitly “human-centric” perspective. This perspective should support and improve the understanding and the utilizations of data for all stakeholders - from governments and companies to citizens.
Workshop focus
We are interested in bringing together multidisciplinary perspectives, especially on the human-centric component of urban visualizations. We invite innovative ideas, design concepts, requirement analysis and work-in-progress relating to the following technical scope:
- Urban data as the basis for urban data visualization e.g. Sensor Networks, Quantified self, citizen science, Open data portals, Open (data) standards, Big data & real-time data challenges
- Human visualization interaction & user-centric design e.g. Co-creation design methods, Visualization for decision support and decision making, Evaluation methods, Stakeholder- & requirement analysis, Visualizations for experts vs. general public
- Visualization challenges e.g. Uncertainty visualization, Spatio-temporal visualization, Network visualization
- Visualization contexts e.g. Visualization of urban processes, Right to the city, production of space, Governance, participation and transparency, Visualizing plans, design, scenarios or futures
- Disruptive technologies e.g. Open source, open analytics and open workflows, Machine learning, AI, tangible interfaces
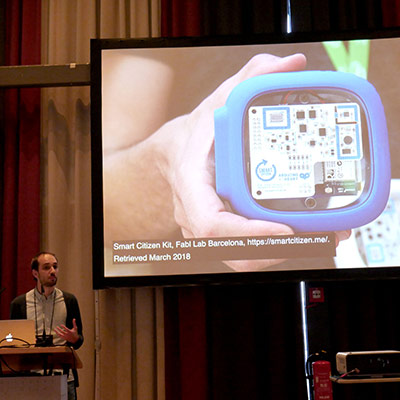
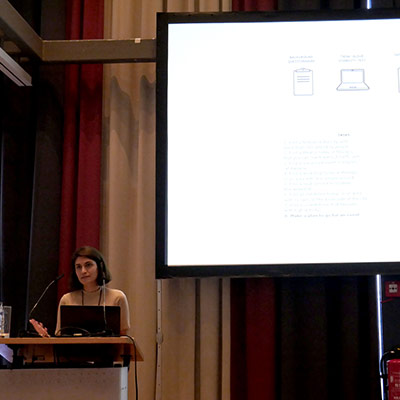
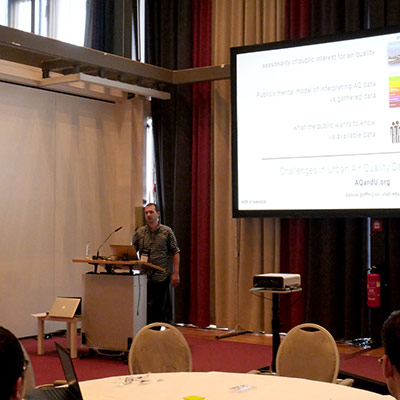
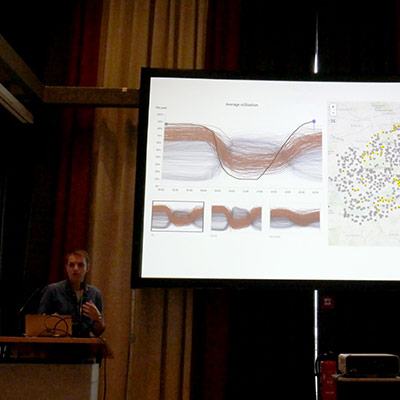
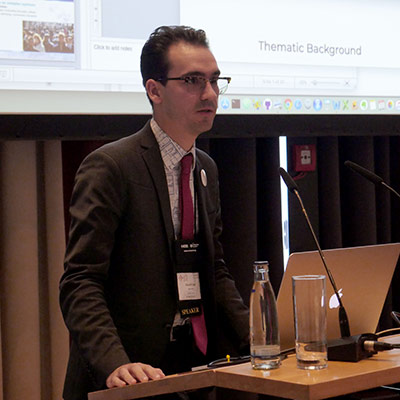
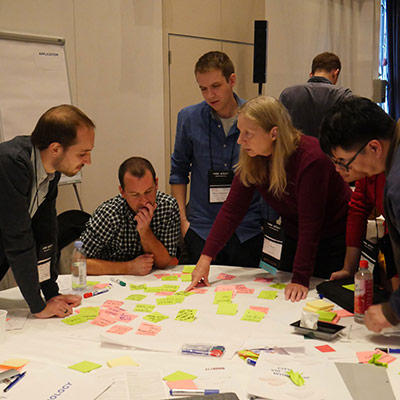
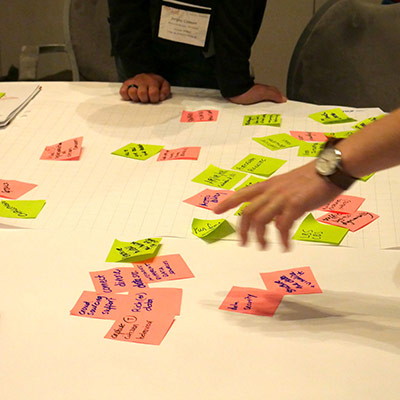
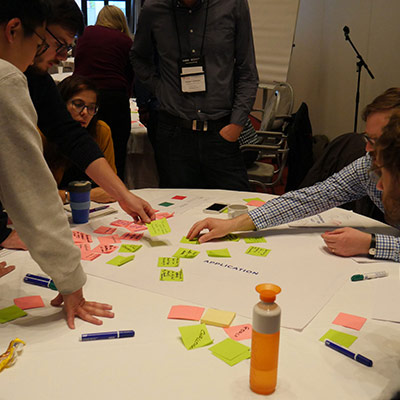
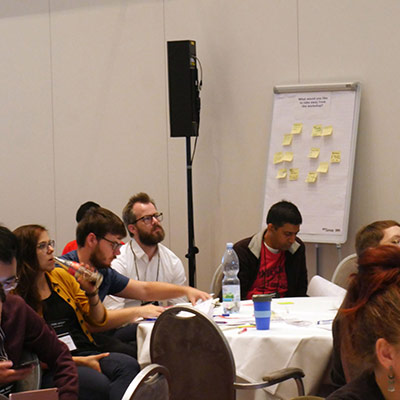
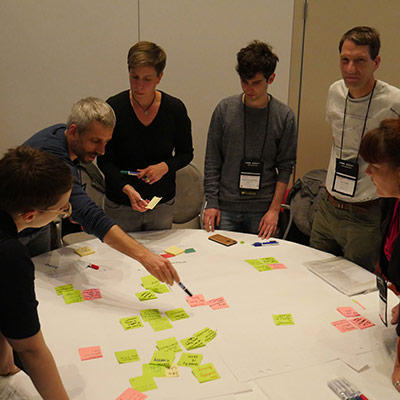
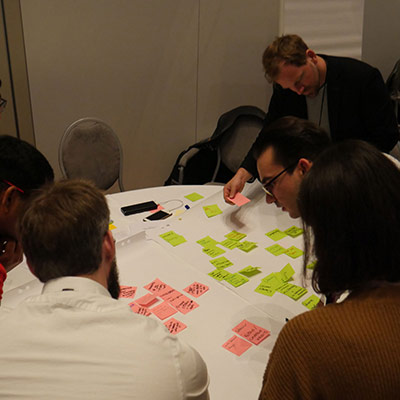
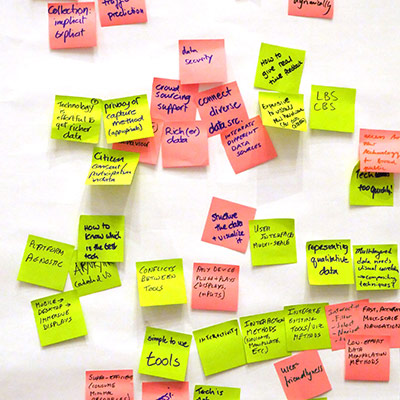
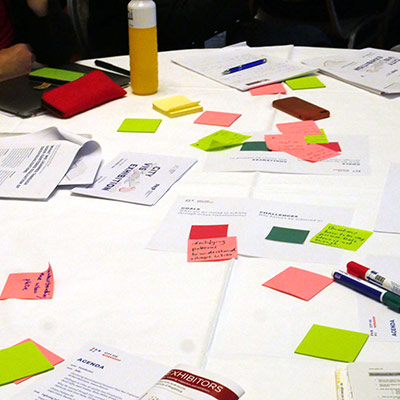
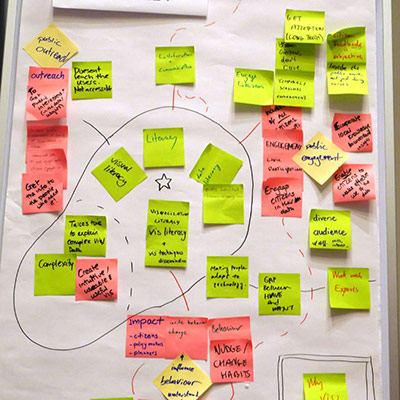
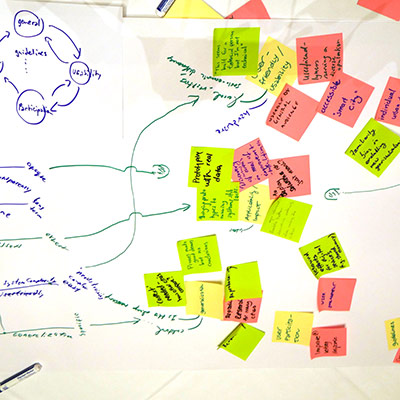
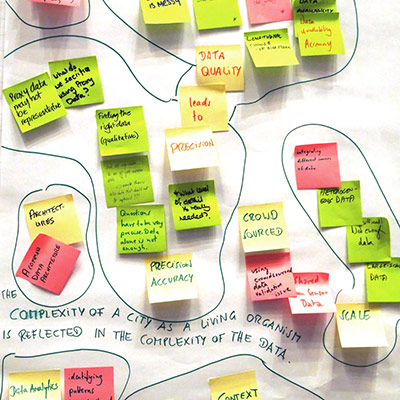
During the workshop, participants will be given a brief introductory presentation by the organizers to outline the workshop scope, followed by a selection of case study presentations (chosen from the accepted papers).he rest of the workshop will consist of interactive activities, making use of creative design thinking techniques, to encourage participants to collaboratively try to refine the definition of the urban data visualization theme. Through this first interactive workshop, we aim to establish a definition, goals, and challenges for urban visualizations.
Workshop Outcome

Chairs
- Sebastian Meier Technologiestiftung Berlin
- Nina Hälker HafenCity University Hamburg
- Sarah Goodwin RMIT/Monash University Melbourne
Program Committee
- Bleisch, Susanne FHNW Northwestern Switzerland
- Davern, Melanie RMIT University
- D'Ignazio, Catherine Emerson College
- Dörk, Marian University of Applied Sciences Potsdam
- Garreton, Manuela Pontificia Universidad Católica de Chile
- Griffin, Amy RMIT University
- Laramee, Robert S. Swansea University
- Nagel, Till University of Applied Sciences Mannheim
- Nieße, Astrid University Hannover
- Noennig, Jörg Rainer TU Dresden
- Pettit, Christopher The University of New South Wales
- Prang, Holger TU Berlin
- Saldarriaga, Juan Francisco Columbia University
- Turkay, Cagatay City, University of London
- Williams, Sarah MIT Media Lab
- Wood, Jo City, University of London
- Xu, Wenfei MIT Media Lab
- Ziemer, Gesa HafenCity University Hamburg


