Competition 2016: Shortlisted in the category
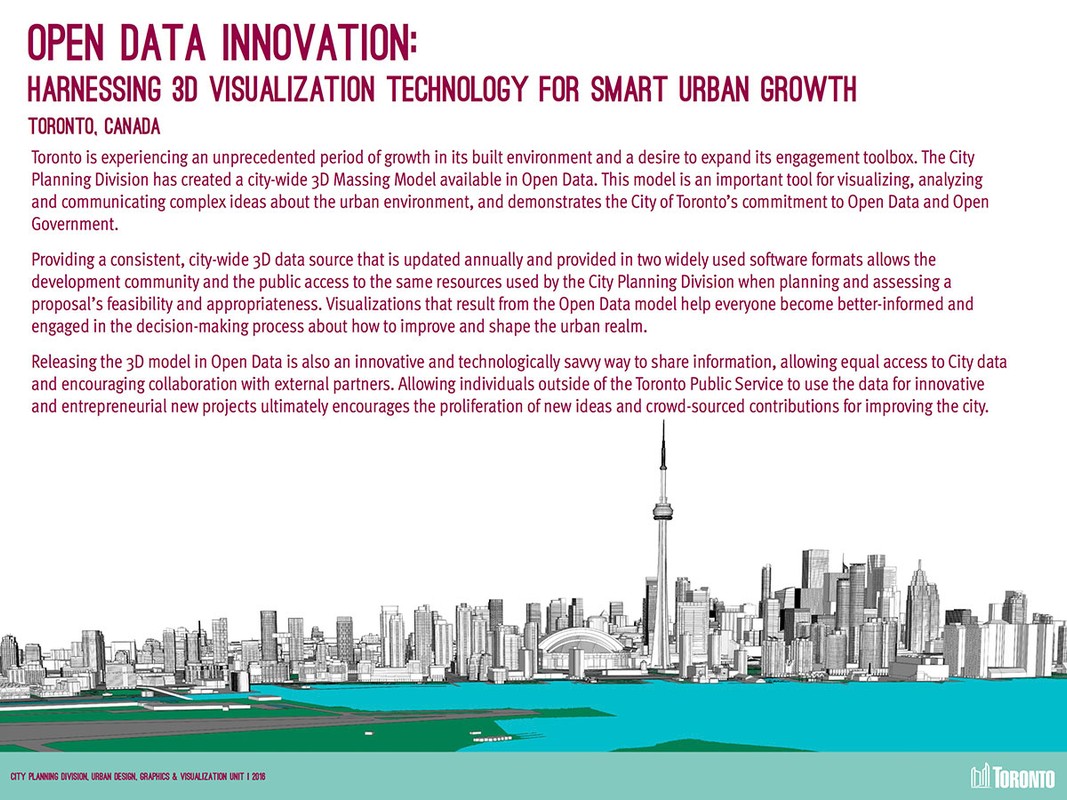
Open Data Innovation: Harnessing 3D Visualization Technology for Smart Urban Growth
City of Toronto, 2015
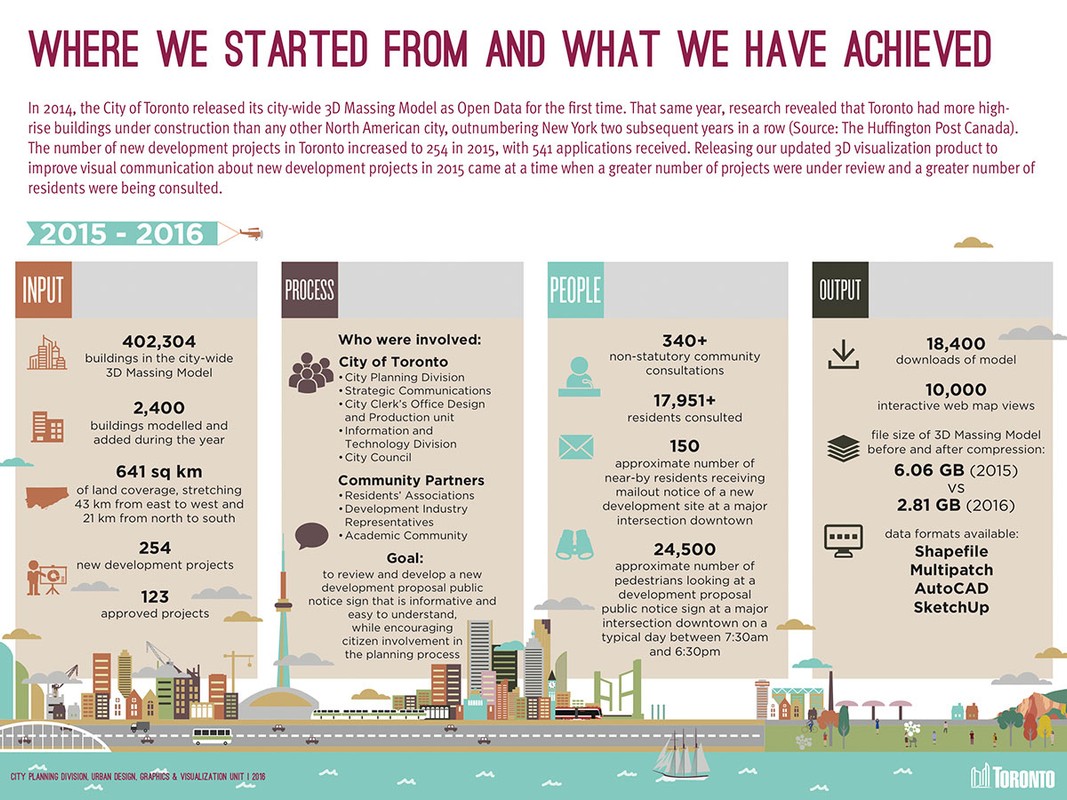
In 2014, the City of Toronto released its city-wide 3D Massing Model as Open Data for the first time. That same year, research revealed that Toronto had more high-rise buildings under construction than any other city in North America, outnumbering New York two subsequent years in a row (Source: The Huffington Post Canada). With increased development activity under review in 2015, the City wanted to engage more residents in community consultations and expand its engagement tool box.
With a focus on engagement with 3D visualization, the 2015 release of the 3D Massing Model in a new file format enabled us to work with our applicants in the development community to create improved visuals for development review that are consistent, recognizable and better understood by the public.
This was a milestone for the City. Implementing cross-sector graphic standards for 3D visualization resulted in efficiencies in the time and cost required to create visual materials. Within the City's specific context, all business and public sector organizations are required by law to comply with provincial accessibility laws such as the AODA (Accessibility for Ontarians with Disabilities Act). These laws provide guidance for compliance and set the framework for how municipalities operate.
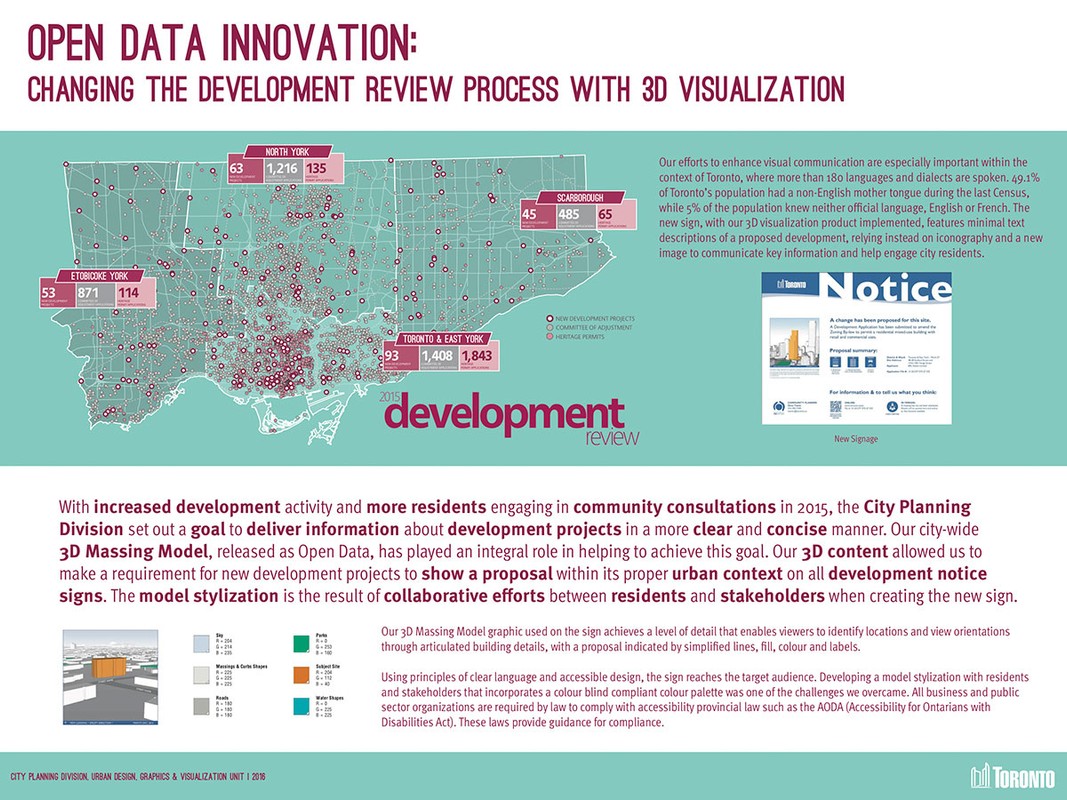
Using principles of clear language and accessible design, a new development notification sign that features the graphic standards, showing a 3D view of a proposal within its proper urban context was developed.
A development notice sign at a major intersection within Toronto's downtown receives approximately 24,500 views on a typical day between 7:30am and 6:30pm. The signs reach a vast audience and are an important component of public engagement for the City of Toronto. Improving these signs by replacing technical drawings with simplified 3D massing views became a priority to help us achieve our engagement goals.
While developing our graphic standards, creating a model stylization with input from residents and stakeholders that incorporated a colour blind compliant colour palette was one of the challenges we overcame. The simplified model stylization was also tailored for viewing across both print and digital mediums, and includes optimized responsive design viewing through websites and social media platforms that work with a range of devices. Through the stylization developed, we are able to convey technical information about proposals including building height and setbacks, shadow impacts, and separation distances within context while meeting accessibility standards.
These efforts to enhance visual communication are especially important in Toronto, where more than 180 languages and dialects are spoken. 49.1% of Toronto?s population had a non-English mother tongue during the last Census, while 5% of the population knew neither official language, English or French.
This Census information informed the design of the new sign, which now features minimal text descriptions of a proposed development, relying instead on the graphic standards created to communicate key information and help engage city residents.
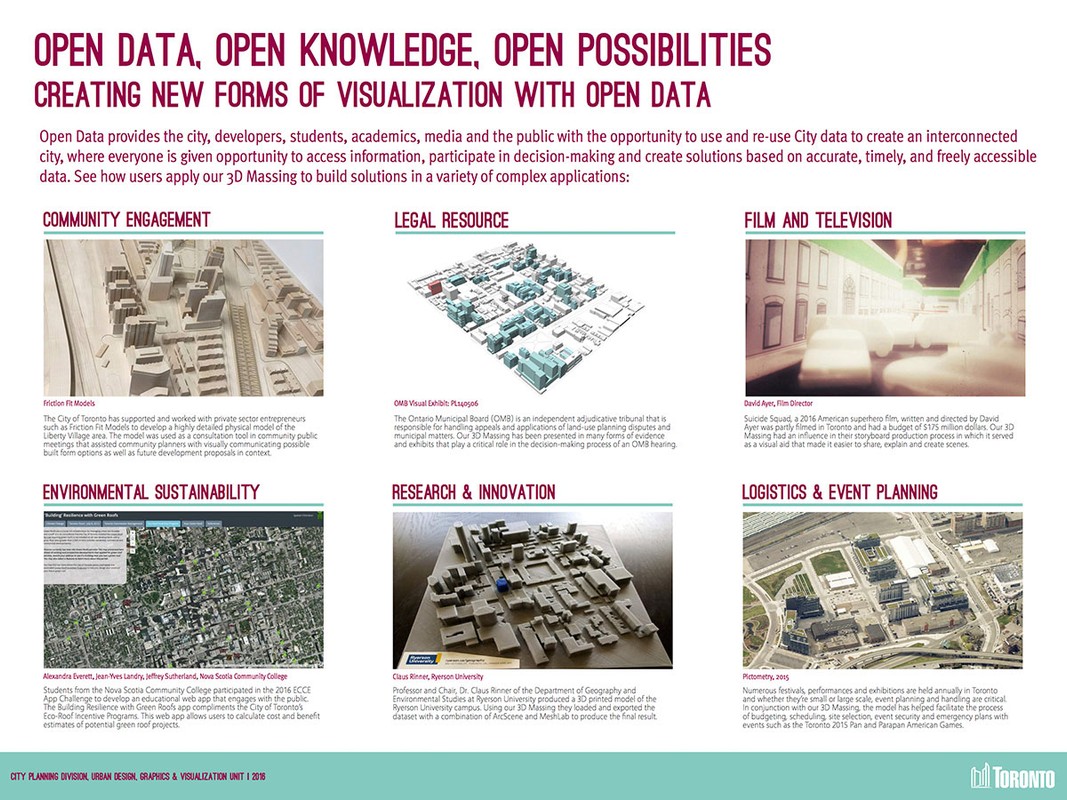
Our 3D Massing Model in Open Data helps improve outcomes for communities by providing data infrastructure and tools that support evidence-based urban planning. The visualizations created from our 3D Massing Model help City staff provide data-driven, objective evidence and advice to help City Council make informed decisions that will protect the needs of individuals and the communities they serve.
Developing cross-sector graphic standards for communicating the data in a clear and concise manner has been a significant step forward in helping to meet the needs of our target audience. The resulting visualizations help everyone become better-informed and engaged in the decision-making process about how to improve and shape the urban realm, for both policy-makers and city residents.


