Competition 2018: Nominated in the category Research
PAXmotion
Mannheim University of Applied Sciences, 2018
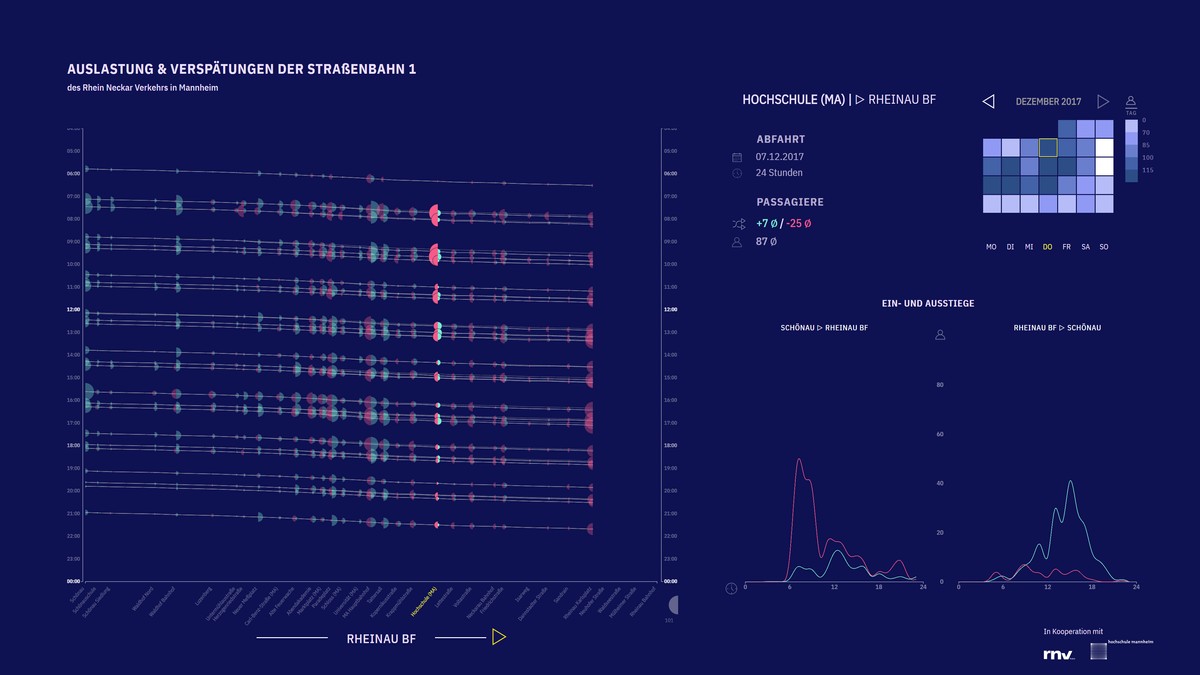
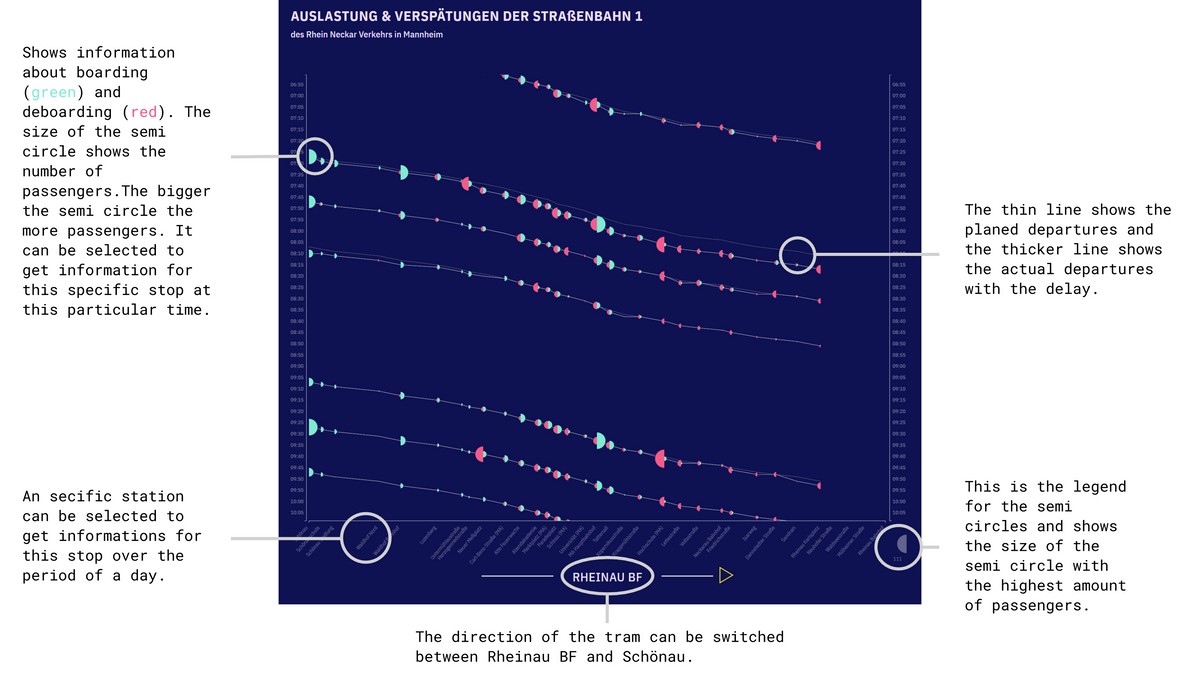
PAXmotion is a visualization system for urban transit planners and policy makers to better understand and explore passenger demands. It visualizes boarding and deboarding passengers, as well as deviations from the time plan in order to allow analyzing possible interplay between these. The system is designed for a large, high-resolution multitouch display.
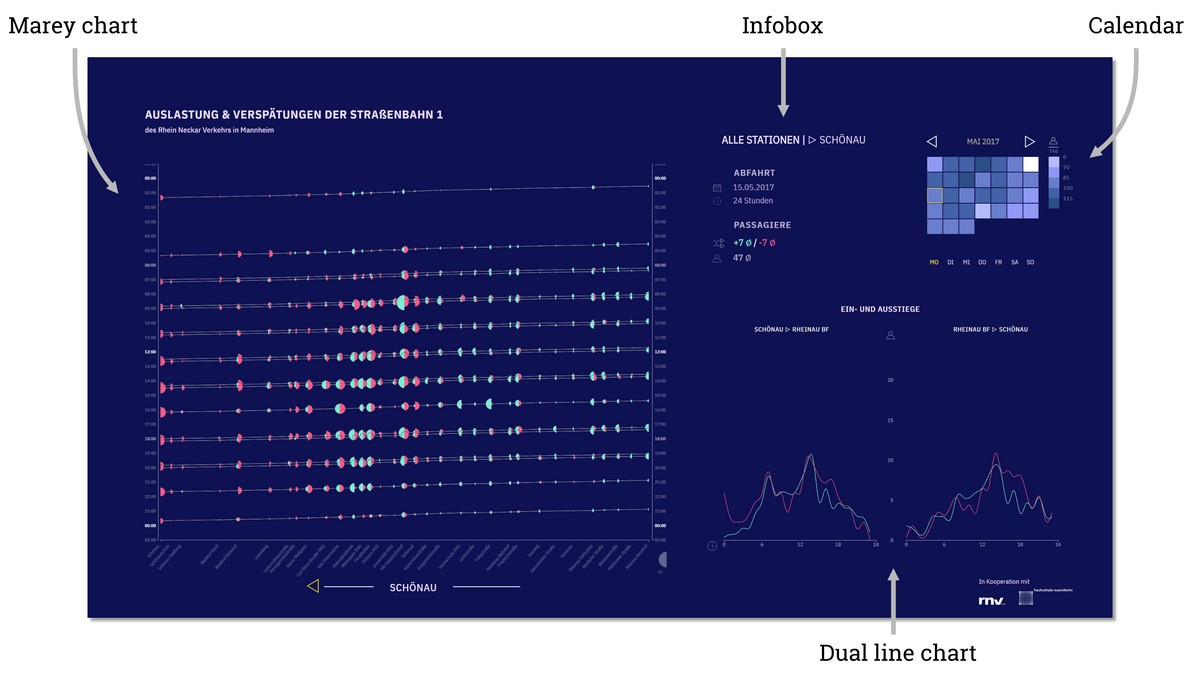
The system consists of three views: 1) An extended Marey chart visualizes the time table and real-time information for all trains running on a line. Glyphs show the amount of boarding and deboarding passengers for each stop at a specific time. 2) Two line chart show boarding and deboarding passengers per hour at a selected station for both directions. Thus, the temporal characteristics of this station can be easily seen with e.g. commuting patterns emerging. 3) A heatmap calendar visualizes passenger volume, and helps to understand general temporal patterns, such as working day behaviour.
All views are interactive and connected. Analysts can select a specific day in the calendar which updates the Marey chart, then choose a station to investigate which highlights that station in the main view as well as in the dual line chart.
PAXmotion is an interdisciplinary research project developed by computer science and design students of the Mannheim University of Applied Sciences, in cooperation with the Rhein-Neckar-Verkehr GmbH, a public transport company.
Links
Authors
Project Partner
Rhein-Neckar-Verkehr GmbH


